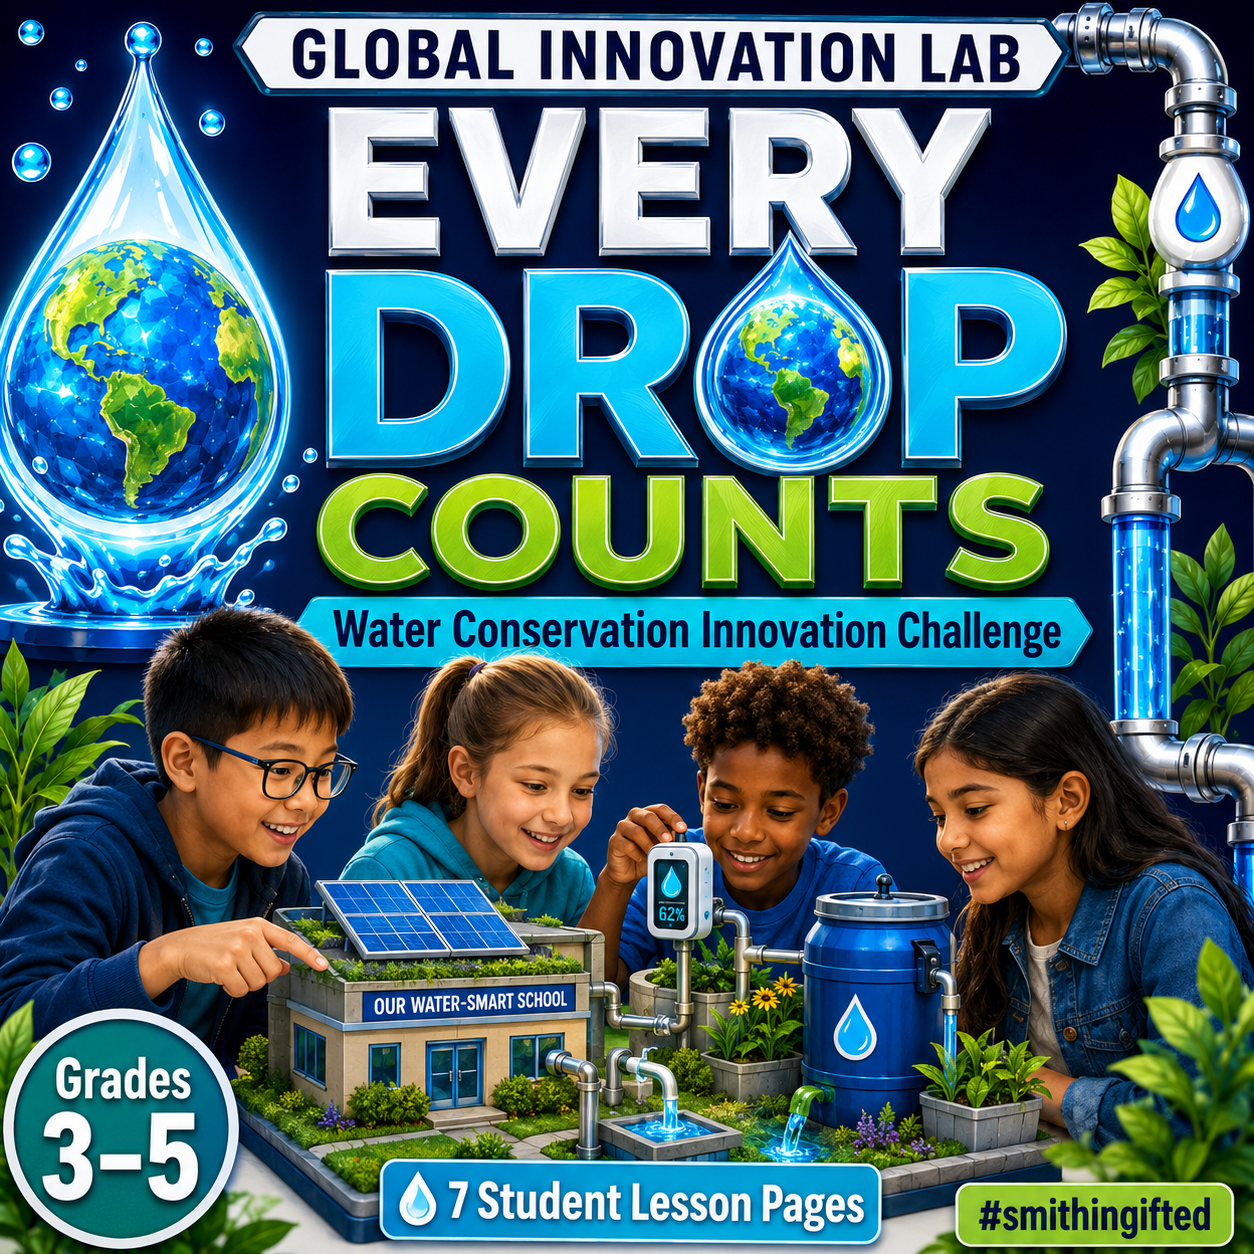
What happens when students stop treating global water issues like a research report—and start treating the data like engineers?
By Beth Smith, M. Ed. | #smithingifted
That is the idea behind my Global Innovation Lab: Every Drop Counts project.
My students are investigating one of the most important questions we can ask:
How does where you live affect your access to clean, safe, and reliable water?
But I didn’t want students simply Googling facts about a country, writing them on a poster, and moving on.
I wanted them to collect comparable data, identify patterns, notice inequities, analyze systems, and use evidence to design solutions.
So I created the Every Drop Counts Student & Teacher KPI Tracker in Google Sheets. 🌎📊💧

👉 Open the Every Drop Counts Google Sheet
🌎 The Problem With “Research a Country”
We’ve all assigned projects that sound something like:
Choose a country and research its water problems.
One student finds three statistics.
Another finds ten.
Someone reports rainfall.
Someone else reports drought.
One student uses current UN data while another pulls information from the first website that appears in a search.
At the end, students may have completed research—but comparing their findings becomes almost impossible.
For the Global Innovation Lab, I wanted something different.
Every student needed to investigate the same core indicators, regardless of whether the student was studying Kenya, Mexico, India, Brazil, Australia, the United States, or another country.
That is where the KPI tracker came in.
📊 Same KPIs. Different Countries. Better Questions.
Every student researches the same core water indicators.
These include:
- Basic Water Access %
- Safely Managed Water %
- Urban Water Access %
- Rural Water Access %
- Urban–Rural Access Gap
- Water Stress %
- Renewable Freshwater per Person
- Total Water Use per Person
- Agricultural Water Use %
- Industrial Water Use %
- Household Water Use %
- Annual Rainfall
Now something powerful can happen.
Students can actually compare systems.
A student investigating Brazil might notice that national freshwater availability is high but begin questioning whether that water is equally accessible throughout the country.
A student studying an arid country might discover that limited rainfall does not automatically mean limited access if the country has strong infrastructure, conservation systems, desalination, or reuse programs.
Suddenly, students start realizing:
Water availability and water access are not the same thing.
And that is the kind of complexity I want gifted learners wrestling with.
🧠 Country Data Is Evidence—Not a Grade
One design decision was especially important to me.
I didn’t want a student studying a country facing severe water stress to automatically receive a lower “score.”
The conditions of a country are data, not student performance.
So the Google Sheet separates country-condition KPIs from the student’s Innovation KPI.
Students are evaluated on the quality of their thinking through the same five indicators:
Evidence Quality • Solution Feasibility • Sustainability • Equity Impact • Systems Thinking
The sheet automatically calculates an Innovation KPI Score from those five measures.
That means a student investigating severe water scarcity in Kenya and a student investigating water management in Australia can still be evaluated with the same expectations for thinking.
That matters.
Fair comparison doesn’t mean students need identical problems.
It means they need consistent criteria for analyzing those problems.
🔍 The Google Sheet Has Four Main Parts
📈 Teacher Dashboard
This gives me a quick look at what is happening across the project.
I can monitor student totals, compare countries, view average Innovation KPI scores, track project completion, and identify trends in areas such as evidence quality, equity, and systems thinking.
Instead of waiting until final presentations to discover who is struggling, I can see it developing during the project.
👤 Student KPI Tracker
This is where students enter their research and project data.
In addition to country statistics, they track:
project status, challenge severity, evidence quality, feasibility, sustainability, equity, systems thinking, milestones, sources, and progress.
The sheet automatically calculates several measures, including:
Urban–Rural Access Gap, Innovation KPI Score, and Project Completion.
📖 KPI Guide
This may be my favorite piece.
Students shouldn’t just enter numbers because a column tells them to.
The KPI Guide explains:
what the metric measures, what unit students should use, why it matters, and the rule that keeps the data consistent.
For example, students learn that safely managed drinking water is not interchangeable with simply having basic water access.
That distinction becomes part of the learning.
📋 Consistent Data Choices
Dropdowns and structured fields keep entries consistent across students.
That sounds like a small spreadsheet feature.
It isn’t.
Cleaner data produces better comparisons, and better comparisons produce better questions.
💡 This Is Where the Gifted Learning Happens
The spreadsheet itself isn’t the lesson.
The thinking that comes from the spreadsheet is the lesson.
Once students have comparable data, I can ask:
NOTICE: What patterns do you see?
COMPARE: Which countries appear to face similar water challenges?
CONTRAST: Why might those challenges have different causes?
CAUSE & EFFECT: What appears to influence water availability?
EQUITY: What does the urban–rural access gap tell you?
SYSTEMS THINKING: How might population, climate, agriculture, infrastructure, economics, and policy interact?
And one of my favorites:
What number on this spreadsheet makes you want to ask another question?
That moves students beyond information collection and into inquiry.
⚙️ Data Becomes an Engineering Constraint
Eventually, students move from researcher to Water Systems Engineer.
Their challenge is not:
Invent something cool involving water.
Instead, it becomes:
Design a solution that makes sense for the evidence you collected.
If agriculture consumes a large percentage of a country’s freshwater, perhaps students investigate drip irrigation.
If rainfall is plentiful but access remains limited, perhaps the real problem is infrastructure.
If the rural–urban gap is large, students may need to think about decentralized systems rather than a solution designed only for a major city.
If groundwater is declining, students might explore recharge systems, water reuse, conservation policies, leak detection, or alternative supply strategies.
The spreadsheet gives students something incredibly important:
constraints.
And constraints make innovation better.
🌱 Why I Use KPIs With Gifted Students
KPIs aren’t just for businesses.
Used appropriately, they teach students to ask:
What should we measure?
How will we know whether something is improving?
What evidence would prove our idea worked?
What happens if one measure improves while another gets worse?
That last question opens the door to trade-offs, which is exactly where systems thinking gets interesting.
A solution might improve water supply but use enormous amounts of energy.
Another might conserve water but be too expensive for the community it is supposed to serve.
Another might work beautifully in a city but fail in a rural area.
There usually isn’t one perfect answer.
And that is exactly why I love this project for gifted learners. 💙
🏆 The Goal Isn’t the Spreadsheet
The goal is to move students through this progression:
DATA → PATTERNS → QUESTIONS → SYSTEMS THINKING → INNOVATION
The spreadsheet simply gives us a common evidence base from which to start.
When students can see the data side by side, the conversation changes.
Instead of asking:
“What did you find?”
we can ask:
“What does your evidence suggest?”
“What relationships do you see?”
“What doesn’t make sense yet?”
“Who is affected?”
“What would you change?”
“How would you know your solution worked?”
That is much closer to the thinking scientists, engineers, policymakers, entrepreneurs, and innovators actually do.
And that’s the kind of learning I want happening in the Global Innovation Lab. 🌎💧🧠
💧 Try the Every Drop Counts Tracker
Use the Google Sheet to have students research different countries while collecting the same core KPIs, then bring the class back together to look for global patterns.
👉 Explore the Global Innovation Lab: Every Drop Counts KPI Tracker
Teacher Tip: This tracker is used by all members of The Global Innovation Lab: Every Drop Counts. If you would like to join email smithingifted@gmail.com to participate.
💬 I’d love to hear what your students notice.
If you used the same water indicators to compare several countries, which statistic do you think would generate the biggest student debate?
Because sometimes the most powerful thing we can give gifted learners isn’t an answer.
It’s better data—and a reason to ask a better question.
#smithingifted | Global Innovation Lab | Every Drop Counts 🌎💧